WebRTC Player Telemetry
Overview
The Netsocs WebRTC player includes a real-time telemetry panel (OSD - On-Screen Display) that shows stream quality metrics at three levels: viewer (browser), relay (DriversHub), and driver (source device). It lets you diagnose connectivity, video quality, and network performance issues without external tools.
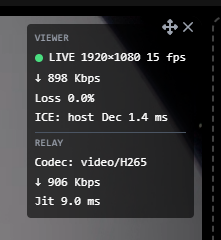
Requirements: - Player in V2 mode (WebRTC/WHEP) - Version 3.3.0 or later
Enabling and disabling the telemetry panel
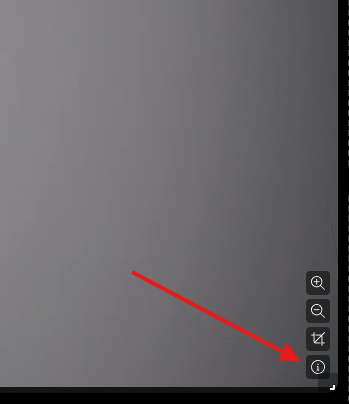
- Hover over the player to reveal the zoom controls (bottom-right corner).
- Click the info icon (circle with an i).
- The OSD panel appears in the top-right corner of the player.
- Click the same icon again to hide it.
The panel state does not persist between sessions; it resets on page reload.
Telemetry panel sections
The OSD refreshes every 10 seconds and shows up to three sections depending on data availability.
Viewer section
Metrics collected directly from the browser's WebRTC connection via RTCPeerConnection.getStats().
| Field | Description | Interpretation |
|---|---|---|
| Status (colored dot) | Indicates whether the stream is flowing | Green = LIVE (frames advancing), Yellow = STALLED (no progress but prior data exists), Red = NO DATA (no statistics available) |
| Resolution | Video frame dimensions in pixels | E.g. 1920x1080. Low resolution may indicate sub quality or encoder limitation |
| FPS | Frames per second decoded in the viewer | Typical range: 15–30 fps. Drops indicate packet loss or limited CPU |
| Bitrate (down arrow) | Received bit rate calculated between two samples | Shown in Kbps or Mbps. Sustained drops indicate network congestion |
| RTT | Round-trip time of the nominated ICE candidate | Round-trip time in milliseconds. Below 100 ms is optimal; above 300 ms may cause visible latency |
| Loss | Percentage of lost packets | 0% is ideal. Values above 1% degrade video quality |
| ICE | ICE candidate type in use | host = direct LAN connection, srflx = NAT traversal without relay, relay = TURN relay (higher latency) |
| Dec | Average decoding time per frame | In milliseconds. High values (>20 ms on modern hardware) indicate CPU overload or software decoding |
Relay section
Metrics published by DriversHub from the server's WHIP/WHEP relay. Updated approximately every 10 seconds on the server and fetched via GET /whip/{streamId}/telemetry?source=relay&limit=1.
| Field | Description |
|---|---|
| Codec | Video codec negotiated by the relay (e.g. H264, H265/HEVC) |
| Bitrate (down arrow) | Bit rate observed at the relay in Kbps or Mbps |
| RTT | Latency measured by the relay |
| Jit | Relay jitter in milliseconds; variation in packet arrival times |
This section only appears if the relay reports at least one telemetry data point.
Driver section
Metrics published by the device driver (e.g. Hikvision) directly to the telemetry endpoint. Updated every 5 seconds on the device and fetched via GET /whip/{streamId}/telemetry?source=publisher&limit=1.
| Field | Description | Interpretation |
|---|---|---|
| RTP | Total RTP packets sent by the driver | Cumulative count; confirms the device is actively transmitting |
| IDR | IDR frames (keyframes) sent | Full reference frames. The player needs them to synchronize the stream. A very low count can cause delays when connecting |
| Err | RTP errors on the driver (shown in red when > 0) | Indicates failures in the device transport layer; may require restarting the channel |
This section only appears if the driver reports telemetry data.
Data collection and submission
The useStreamTelemetry hook runs a cycle every 10 seconds per active viewer:
- Reads WebRTC statistics from the local
RTCPeerConnection. - Calculates bitrate, packet loss, and decoding time between consecutive samples.
- Detects whether the stream is flowing by comparing
framesDecodedbetween samples. - Sends a telemetry data point to the server via
POST /whip/{streamId}/telemetry(fire-and-forget). - Queries the latest relay and publisher data points in parallel to update the OSD.
Each viewer session generates a unique UUID viewer_id when the component mounts, allowing the backend to correlate multiple viewers of the same stream.
Diagnosing common problems
| OSD symptom | Possible cause | Suggested action |
|---|---|---|
| Status STALLED (yellow) | Network congestion or encoder stopped | Check connectivity; review the channel status in the driver |
| Status NO DATA (red) | PeerConnection has no statistics yet or stream not started | Wait for the first 10-second cycle; if it persists, check the WHEP connection |
| Loss > 1% | Packet loss on the network | Review the network between the browser and the relay; consider switching to sub quality |
| ICE: relay | Browser could not connect directly | The TURN server is being used; this may increase latency |
| Err > 0 on Driver (red) | RTP errors on the source device | Restart the video channel in the device configuration |
| Relay section absent | DriversHub received no relay data | Verify that the DriversHub service is online and the WHIP stream is active |
| Driver section absent | Driver does not send telemetry | The device model may not support active telemetry |
Privacy and performance considerations
- Telemetry data includes stream and viewer identifiers but contains no video or audio.
- Requests use
keepalive: trueto avoid blocking when the tab is closed. - Performance impact is minimal: one
getStats()call and two HTTP requests every 10 seconds per viewer. - Disabling the
player_webrtc_telemetry_infofeature flag completely removes the OSD button and stops viewer data collection.