Documentation: Open Dashboard Node
Overview
The Open Dashboard Node is an action node that, when executed, automatically opens a specific dashboard (workspace) in the interface of selected users (or all users), changing the view on their screen.
It is a key tool for control centers and IoT monitoring rooms: when a relevant event occurs, the flow can take operators directly to the dashboard that allows them to manage the situation (for example, the dashboard of a specific industrial plant, a map, or a synoptic), without them having to navigate manually.
When to use this node?
Use this node when you need to:
- Direct operators' attention to the correct dashboard in response to an event (for example, open the plant dashboard where an alarm was triggered).
- Change the view of users in a control room in a coordinated manner during a contingency.
- Show a specific group of users a synoptic, map, or panel relevant to an operational situation.
- Automate response protocols that require personnel to see certain information immediately.
Node Configuration
The node has two configuration tabs at the top: Form and JSON Editor.
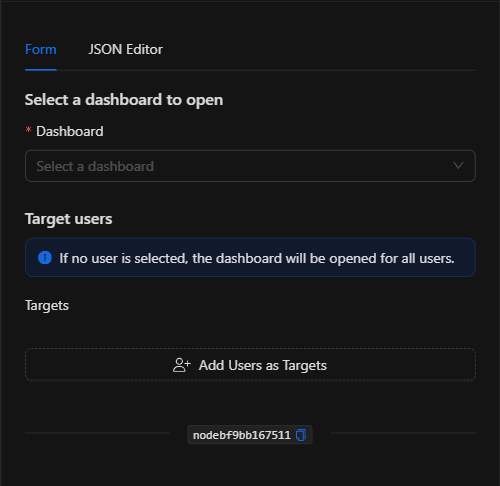
Form View
1. Dashboard *Required
Select, from the dropdown, the dashboard (workspace) that will be opened. The selector lists all workspaces available in the installation and allows searching by name.
2. Target Users *Optional
Defines for which users the dashboard will be opened.
INFO: As the node itself indicates: "If no user is selected, the dashboard will be opened for all users." That is, if you do not select any user, the dashboard will be opened for all users.
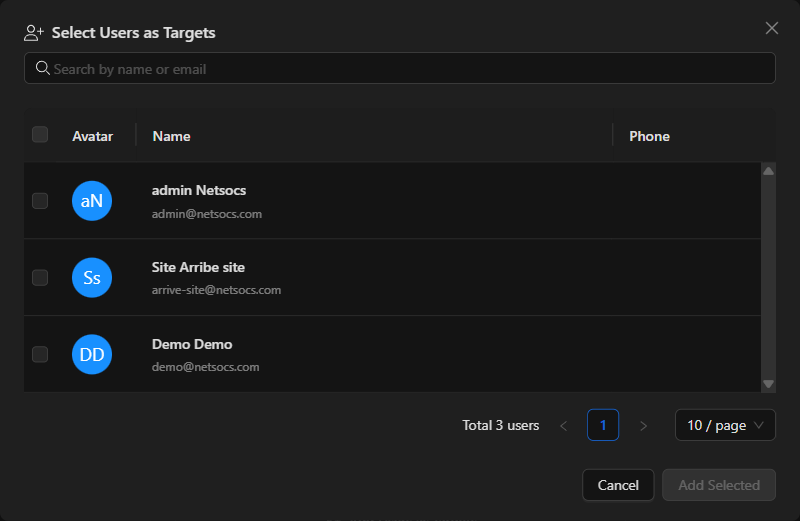
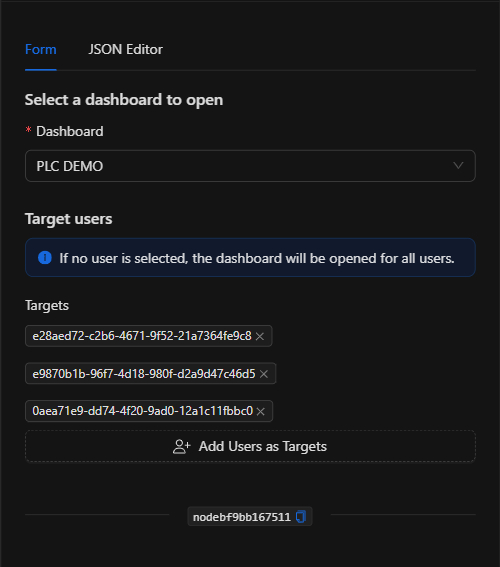
- Click
Add Users as Targetsto open the Select Users as Targets modal, where you can search and check the users who will receive the dashboard opening. - Selected users are displayed as tags (with their ID) that you can remove individually.
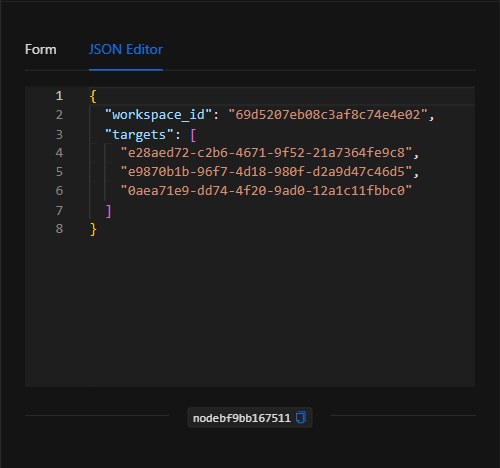
JSON Editor View
In the JSON Editor tab you can view and directly edit the dashboard ID and the list of target users:
JSON Structure (Input Parameters)
Below is the JSON structure generated when configuring the node:
{
  "workspace_id": "69d5207eb08c3af8c74e4e02",
  "targets": [
    "e28aed72-c2b6-4671-9f52-21a7364fe9c8",
    "e9870b1b-96f7-4d18-980f-d2a9d47c46d5"
  ]
}
JSON Fields
| Field | Type | Description |
|---|---|---|
workspace_id |
string | ID of the dashboard (workspace) to be opened. Required. |
targets |
array (string) | List of user IDs for whom the dashboard will be opened. If empty, it opens for all users. |
Output: Where the node's data comes from
The Open Dashboard Node is an interface command-type action: its effect is to change the view of the target users, opening the specified dashboard for them. Therefore, it does not expose a structured data payload in its output; when executed successfully, the node finishes marked as successful (green border) and the dashboard opens in the corresponding users' sessions.
NOTE: For the view change to be visible, the target users must have an active Netsocs Synergy session open. This node is designed for active monitoring environments (control rooms).
Usage Examples
Example 1: Open the plant dashboard upon an industrial alarm
Use case: When a critical alarm is triggered in a plant, the control center operators are automatically taken to that plant's dashboard (with its PLCs, sensors, and cameras) to manage the incident.
- Dashboard:
PLC DEMO - Target users: Shift operators (or empty for all).
Configuration JSON:
{
  "workspace_id": "69d5207eb08c3af8c74e4e02",
  "targets": [
    "e28aed72-c2b6-4671-9f52-21a7364fe9c8"
  ]
}
Example 2: Open a synoptic for all users during a contingency
Use case: During a general contingency (for example, an evacuation), the emergency synoptic is opened for all connected users.
- Dashboard: The emergency synoptic.
- Target users: (empty → all users)
Configuration JSON:
{
  "workspace_id": "69d5207eb08c3af8c74e4e02",
  "targets": []
}
Validation and Errors
| Condition / Common cause / fix |
| :--- | :--- |
| workspace_id missing | Select a dashboard from the dropdown. It is required. |
| The dashboard does not open | Make sure the target users have an active Netsocs Synergy session. |
| It opened for all users unintentionally | Remember that leaving targets empty opens the dashboard for all users; add target users if you want to restrict it. |
Best Practices
- Name the node descriptively: Change the node name on the canvas (e.g., "Open plant dashboard") to identify it within the flow.
- Restrict users when appropriate: Use the
targetslist to direct the opening only to relevant personnel and avoid interrupting users who do not need it. - Combine with notifications: Accompany the dashboard opening with a notification that explains why it was opened, to give context to the operator.
- Verify the target dashboard: Make sure the selected workspace contains the appropriate operational information for the situation triggering the flow.