Offline Channels KPI
A video channel that goes down doesn't announce itself. The camera stops reporting, its tile turns black, and if nobody happens to be looking at that tile, the failure can sit unnoticed for hours. In a site with hundreds of channels spread across several NVRs, walking the device tree one by one is not an option.
The KPI widget solves this with an always-visible indicator: a large number on your dashboard answering, at a glance, how many video channels are offline right now? And because the count can be scoped by domain, the same widget serves both a global reading of the entire platform and a reading per site, building or equipment brand.
This guide builds that indicator step by step: first the global version, then the variant scoped to a domain.
Prerequisites
| Requirement | Detail |
|---|---|
| Video channels integrated | At least one video device (NVR or camera) must be registered, with its channels published as objects of type video_channel. |
| User permission | Your user needs the dashboard:canSeeKpiWidget permission. Without it, the KPI widget does not appear in the catalog. |
| Permission to edit the dashboard | To add widgets, the dashboard must not be locked and your user must be able to modify it. |
Why the native KPI is not enough
When you open the KPI catalog you will find a Native KPIs tab with an indicator called Online/Offline objects. It is tempting to use it, but it does not answer the question this guide is about.
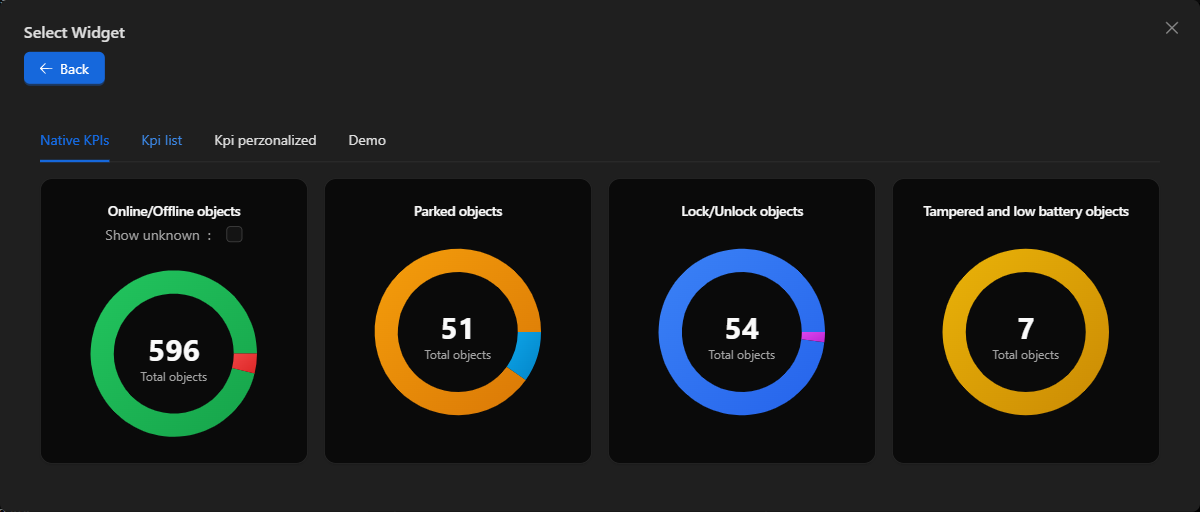
That native KPI counts every object in the platform: video channels, but also sensors, doors, locks, readers and video engines, all mixed into the same donut. It takes no configuration at all: no object-type filter, no domain filter, no custom title.
To count video channels only, and to be able to scope them by domain, you need to create a custom KPI. That is what we do next.
Step 1: Add an empty widget
In the dashboard toolbar, press Add. An empty widget appears in the grid. Click it, on the Select Widget text.
Step 2: Pick the KPI widget
The widget catalog opens. Type KPI in the search box and select the KPI (Key Performance Indicator) card.
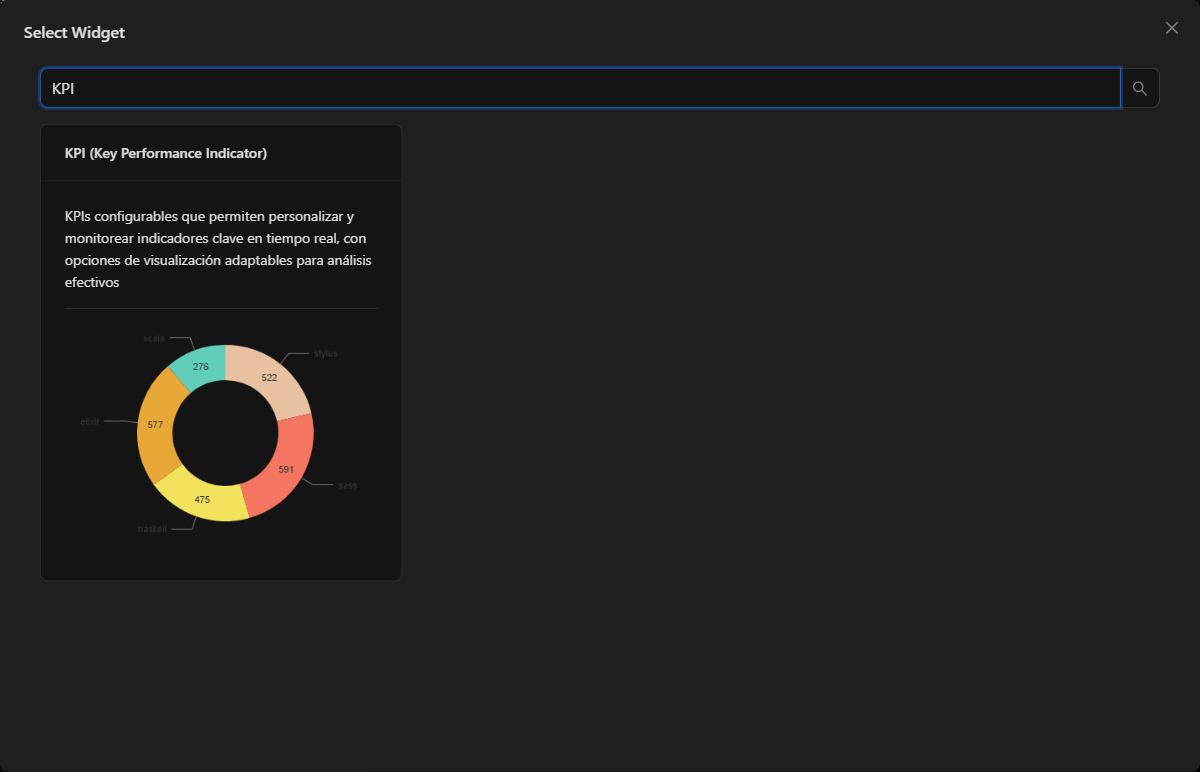
Inside the KPI widget you will see four tabs. Open Kpi perzonalized, which leads to a four-stage wizard: Basics, Chart type, Data and Review.
Step 3: Name the indicator
In Basics, type a name in KPI name. This is the name you will later see in the list of saved KPIs and as the widget title, so make it explicit: Offline video channels.
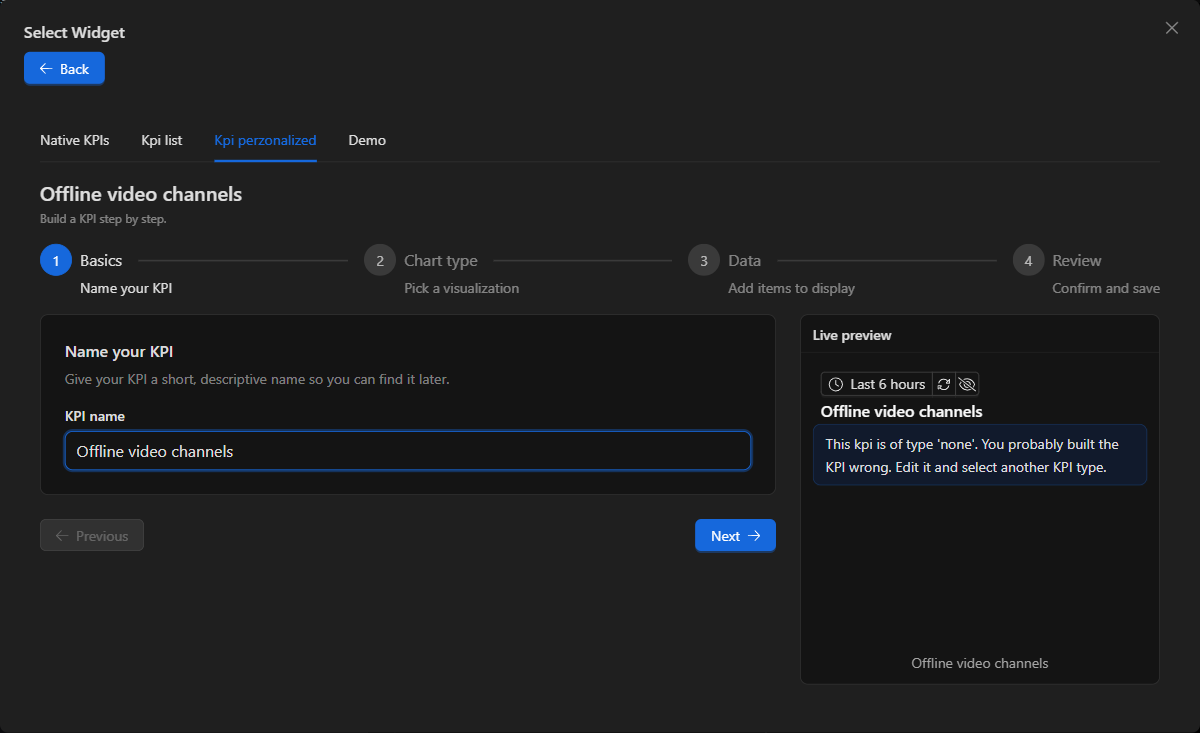
Continue with Next.
Step 4: Pick the visualization
In Chart type, choose Big number (Single highlighted metric). It is the right format for this case: a single figure, large and readable from across the room, which is exactly what you want from an offline-channel indicator.
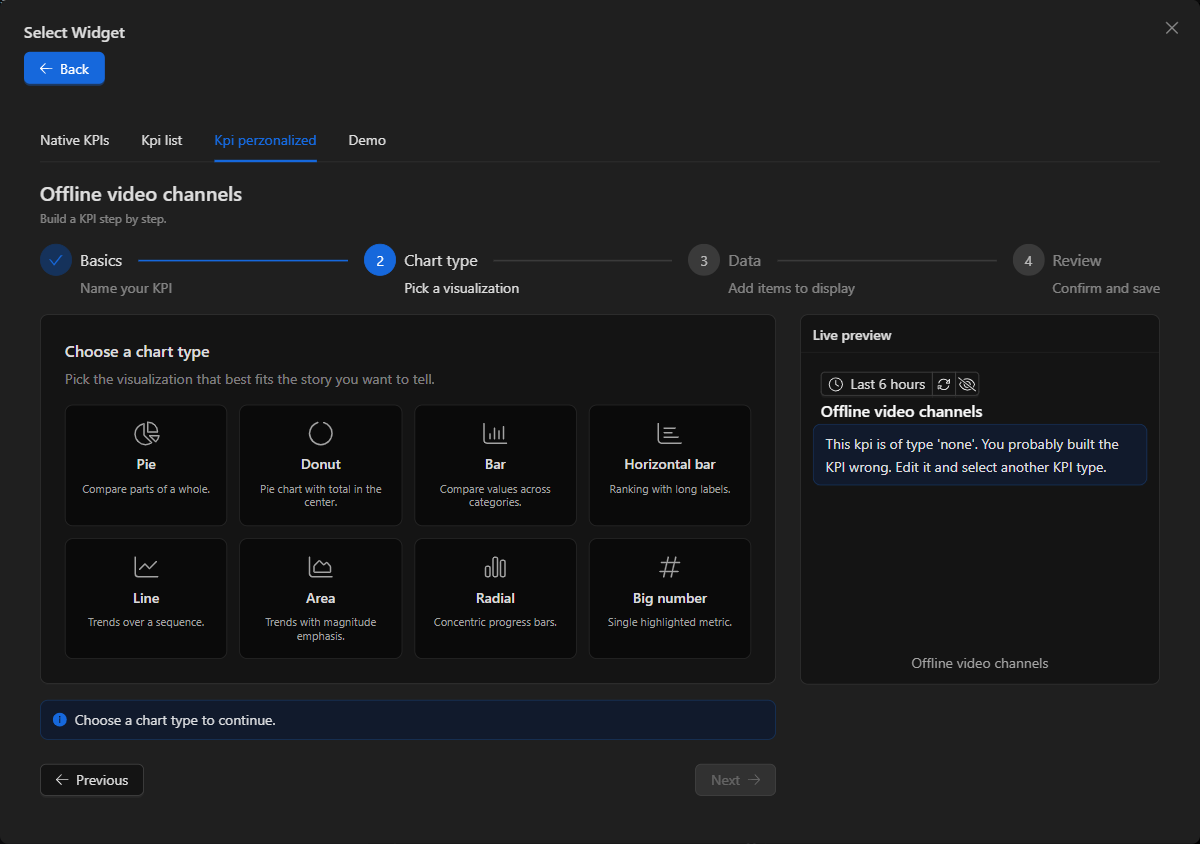
TIP The other formats (Pie, Donut, Bar, Line…) make sense when a KPI compares several items against each other. If you later want to compare how many channels are down in each domain, add one data item per domain and choose Bar instead of Big number.
Step 5: Define the data source
This is the step that does the work. In Data, press Add item: each item is one value the KPI will display.
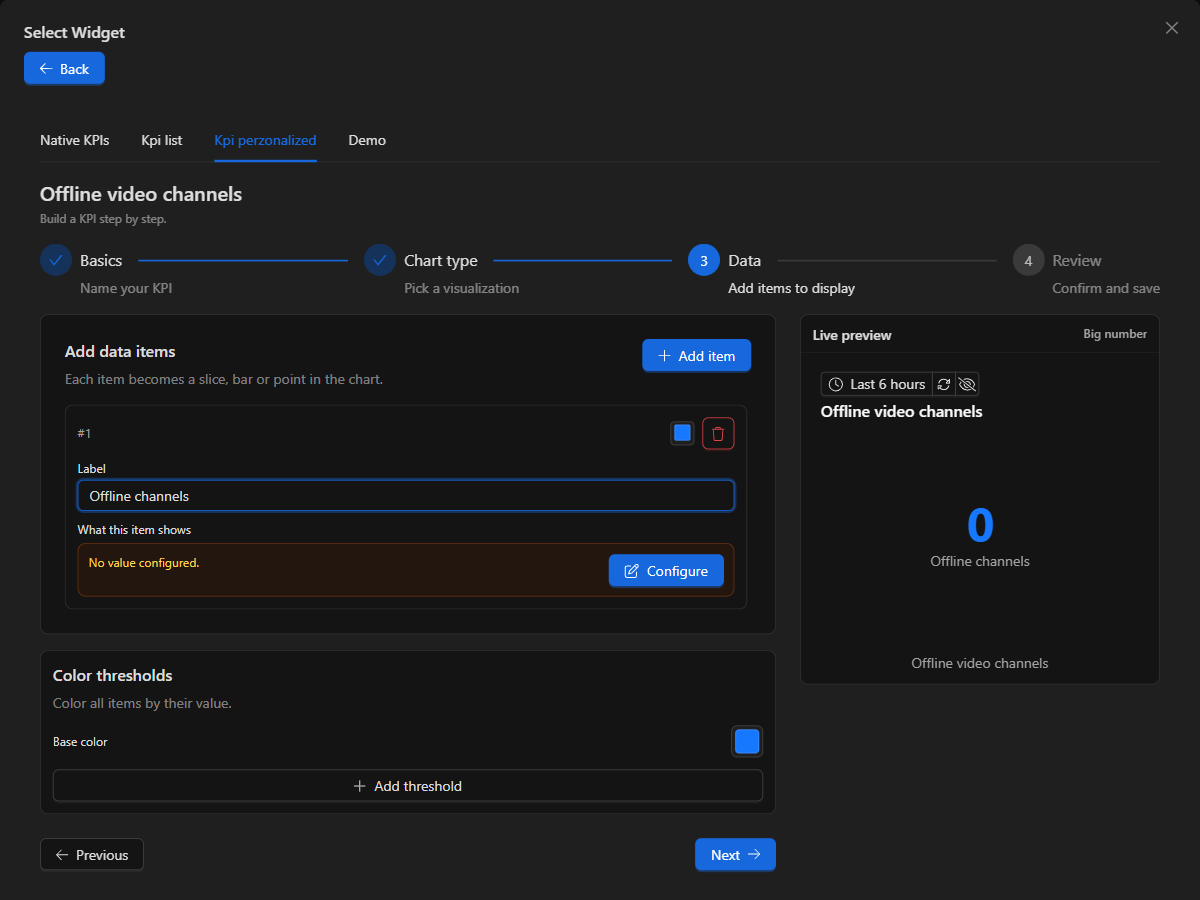
Type a label in Label —for example Offline channels— and press Configure to open the Configure data source side panel.
There, the first decision is where the data comes from. Leave the first option selected, Object count, and fill in the fields like this:
| Field | Value | What it does |
|---|---|---|
| Domain (optional) | (empty) | Counts across all domains. This is the global reading. |
| Object type (optional) | video_channel |
Restricts the count to video channels. It is a tag field: type the value and confirm with Enter. |
| Filter by property (optional) | offline — equals |
The state property that tells whether the channel lost its connection. |
| Value to match | true |
Only counts channels whose offline property is true, that is, the ones that are down. |
| Value to show | Current value (latest) | Shows the most recent value, not an average over the range. |
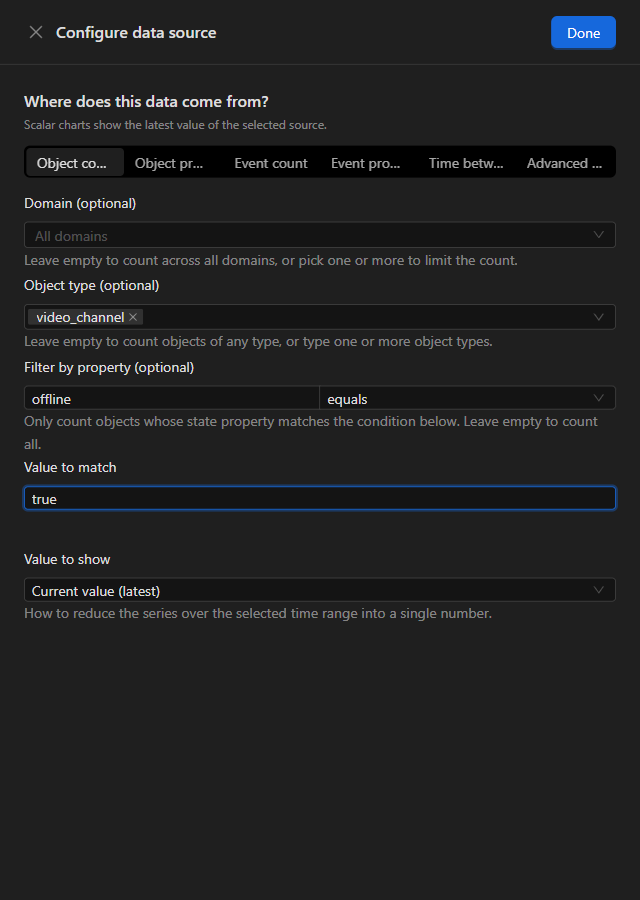
Below the item, the wizard summarizes in one sentence what you just built: Count of objects where offline equals true of type video_channel. If that sentence describes what you are after, the configuration is right.
Close the panel with Done.
Step 6: Scope it to a domain
To make the indicator count only the channels of one part of the installation, open Configure again and expand Domain (optional).
Video channel domains follow the device_brand.video_channel pattern, so typing video in the search box is enough to list them all:
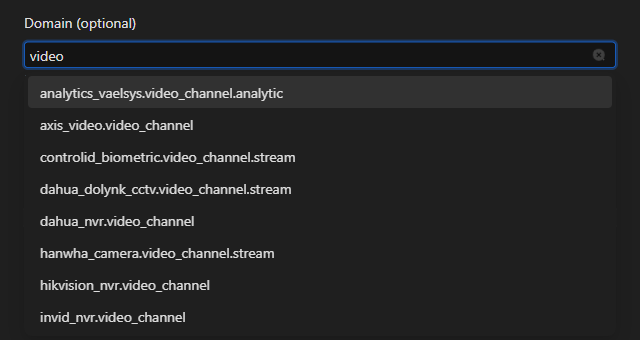
Pick one or several. The field accepts multiple selection, so you can group, for example, every NVR of one site.
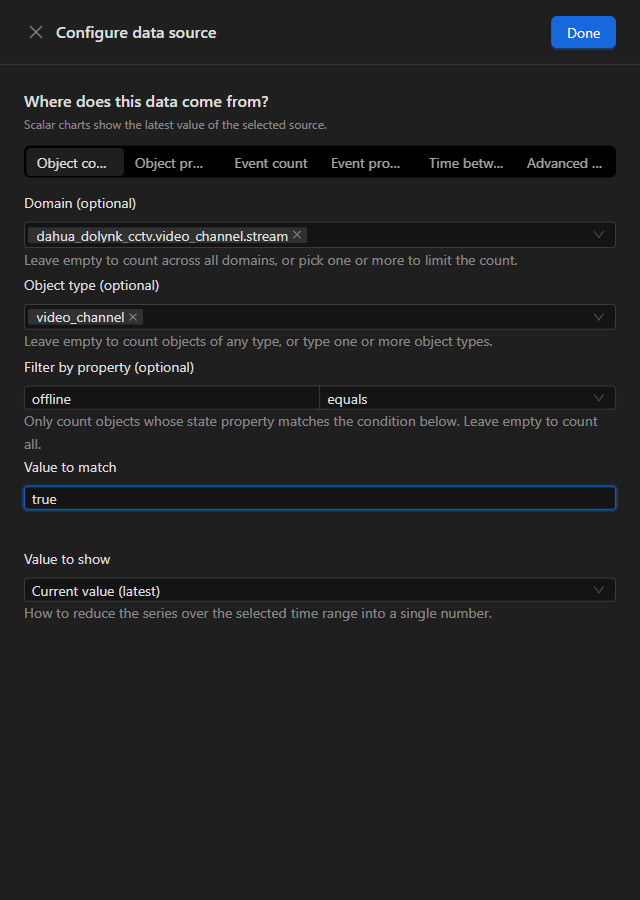
The item summary now reflects the scope: …of type video_channel in domains: dahua_dolynk_cctv.video_channel.stream.
INFO An empty field is the global mode; there is no "All" option to tick. The field's own help text says so: Leave empty to count across all domains, or pick one or more to limit the count.
See Domains to understand how they are built and what they group.
Step 7: Color the number by its value
A 0 and a 14 do not mean the same thing, and the widget can say so with color. In the Color thresholds block, Base color is the number's normal color; with Add threshold you add a value above which the number changes color.
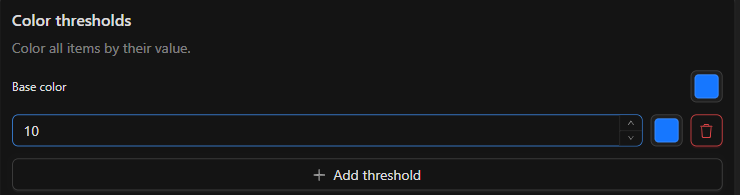
A sensible scheme for downed channels: green as the base, an amber threshold at 1 (at least one channel is down) and a red one at 10 (several channels down at once, something that deserves immediate attention).
The number takes the color of the highest threshold it reaches: with this scheme, a 0 shows green, a 3 amber and a 12 red.
Step 8: Review, save and place
In Review you get the KPI summary: name, chart type and the detail of each item. Confirm with Save KPI.
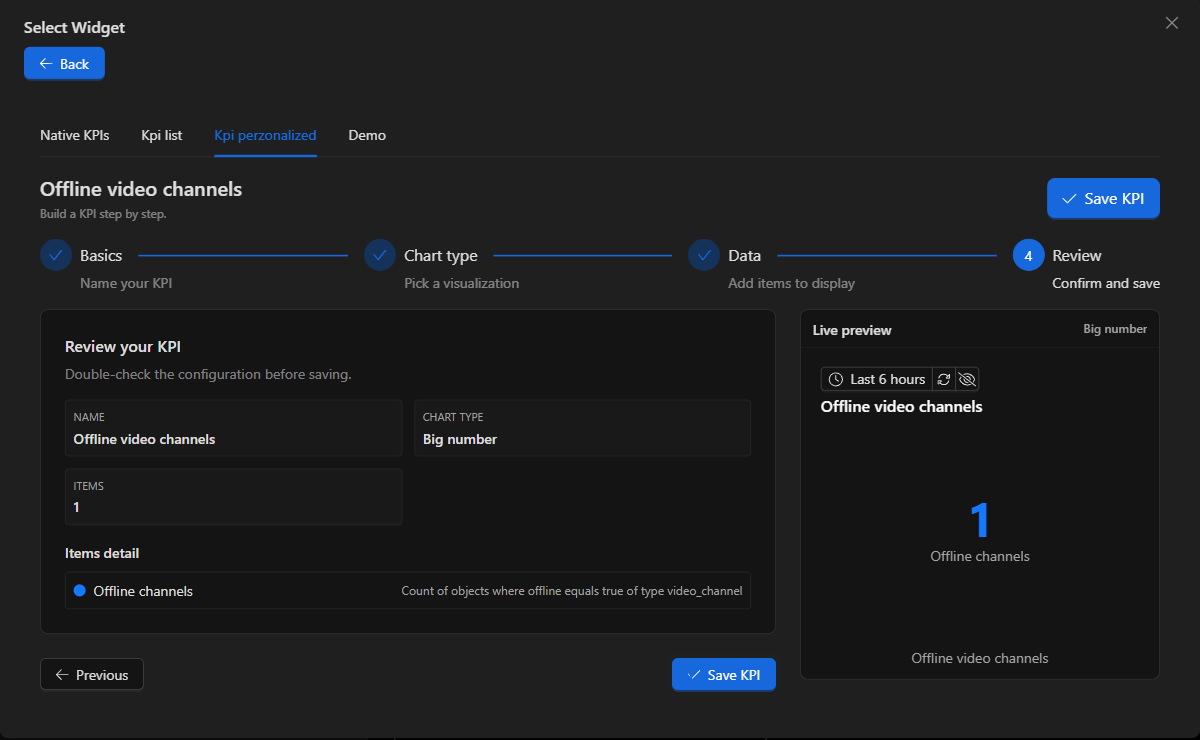
The KPI is saved and appears in the Kpi list tab, from where you can reuse it on other dashboards, edit it or delete it. Click its card to place it into the empty widget.
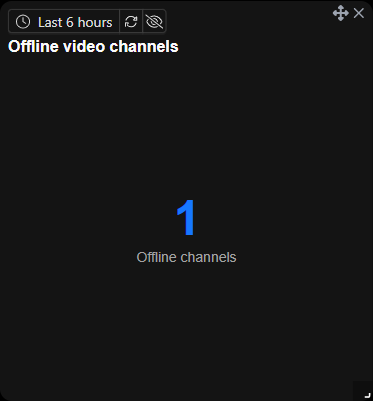
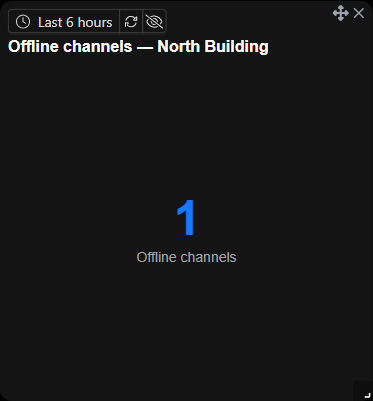
By repeating the process you can have, side by side, the global indicator and one per site you care to watch.
Time range and refresh rate
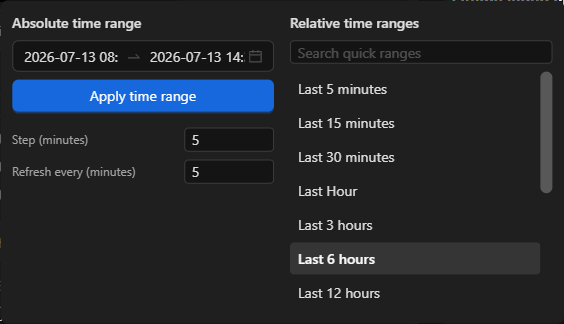
The clock-shaped control in the widget's corner governs the time window. It is not configured in the wizard but on the placed widget, and the choice is remembered for that KPI.
| Control | What it is for |
|---|---|
| Relative time ranges | A moving window: Last 5 minutes, Last Hour, Last 6 hours… This is the usual choice. |
| Absolute time range | A fixed window between two dates, useful to review a past incident. |
| Refresh every (minutes) | How often the widget queries again. Default is 5. |
TIP For a live operations board, lower Refresh every to
1. An offline-channel indicator that refreshes every 5 minutes may take that long to notice an outage.
How to read the number
The count is derived from the state properties that channels report to the platform: it counts video_channel objects whose offline property is true. Two things are worth keeping in mind when interpreting it.
A channel that never reported its state is not counted. The indicator relies on each object's state history; a freshly integrated channel, or one whose driver does not publish the offline property, will not be counted even if it is down. That is why you should cross-check the KPI's number, at least once after configuring it, against the dashboard tree, where each device's state is visible case by case.
A 0 does not always mean "everything is online". If the query to the server fails or times out, the widget shows 0 without flagging the error. Faced with a persistent zero in a large installation, refresh the widget with the reload button to confirm the figure is real.
NOTE The
offlineproperty is documented as part of the state of the Video Channel object type, along with the other states a channel can report.
Best practices
- Start global, then break it down. A single indicator with the total tells you whether there is a problem; the per-domain indicators tell you where. Having both on the dashboard is what turns the number into something actionable.
- Name KPIs after what they watch, not how they are computed.
Offline channels — North Buildingis understood immediately;KPI object_count offlineis not. - One domain per equipment brand. Because domains include the device brand (
hikvision_nvr.video_channel,dahua_nvr.video_channel), a per-domain indicator tells you whether the downed channels cluster on one manufacturer's equipment or are spread across all of them, which points you at where to start looking. - The KPI observes; automation reacts. To learn about an outage without watching the dashboard, pair the indicator with a rule on the channel's state. See Your first automation.