Create a custom Event Log
By default, the event log you see on the dashboard is the Admin Events Log: it shows every event in the system, unfiltered. On an installation with many devices that means hundreds of events per hour, and the alerts you actually care about get lost among them.
This guide shows how to create your own Custom Event Log: a named log that shows only the alert types you care about, and only from the objects or devices you care about.
The example creates a log called Lobby Person Alerts that shows nothing but the person detections from a Hanwha camera, ignoring everything else.
Concepts: a log and a filter are two different things
Before you start, it helps to be clear that two separate elements are involved:
| Element | What it defines | Where it lives |
|---|---|---|
| Event Log | Its name, which columns it shows and which filters are attached to it. | Saved in the system and available to any dashboard. |
| Event Filter | Which event types are included (or excluded) and from which objects. | Saved separately and reusable across several logs. |
A log can have one or more filters attached. And a single filter (for example, "Person detection in the lobby") can be reused by every log that needs it, without configuring it again.
IMPORTANT: A log with no filters attached shows every event, just like the admin log. The filter is what does the narrowing.
Step 1: Open the widget selector
- On a dashboard, click an empty slot labeled
Select Widget. If you don't have one, first use theAddbutton in the top bar to add a new slot. - In the library, find and select the
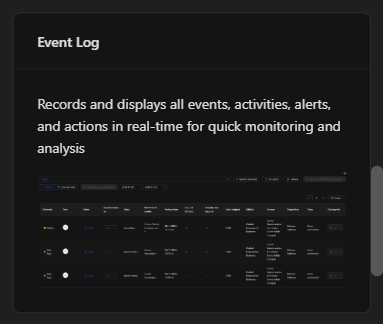
Event Logcard.
Step 2: Review the existing logs
A screen opens with two tabs: Available Event Logs and Create Custom Event Log.
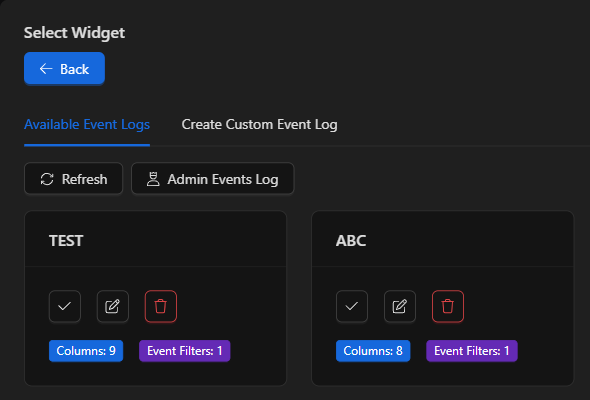
The first tab lists the logs already created. Each card shows its name and two tags summarizing its configuration: how many Columns it has and how many Event Filters are attached to it. The three buttons on each card let you, in order: use the log in this widget, edit it and delete it.
The Admin Events Log button loads the unfiltered log that shows absolutely everything. It is the one used by default and cannot be deleted.
Step 3: Create the log and choose its columns
- Open the
Create Custom Event Logtab. - Under
Name of the new event log, type a name that describes what you are going to monitor, for exampleLobby Person Alerts. - In the
Customize Columnstab, move the columns you want to see to the right-hand panel. Check each one in the left list and use the>arrow.
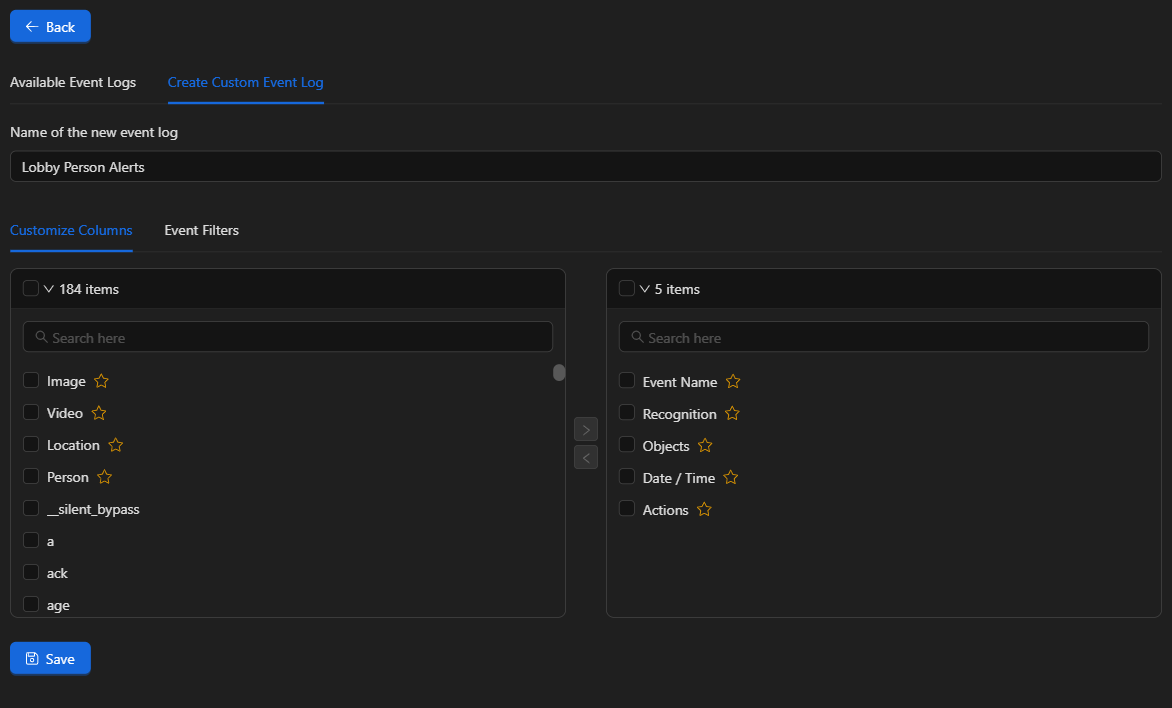
The columns marked with a star are the system's native ones: Event Name, Recognition, Image, Video, Objects, Date / Time, Actions, Location and Person. The rest of the list are additional properties published by the various drivers, so the total varies with your installation (189 in the example).
NOTE: You must select at least one column; until you do, the
Savebutton stays disabled.
Step 4: Create the event filter
This is where you define which alerts you care about.
Open the Event Filters tab and click Add Event Filter. A three-step wizard opens.
4.1 Basic step: name the filter
Type a descriptive name. Since the filter can be reused by other logs, it should make sense on its own — for example, Person detection - Hanwha camera.
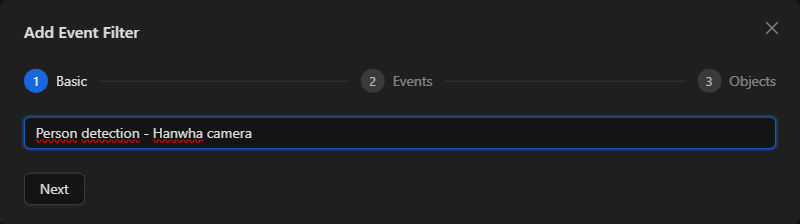
Click Next.
4.2 Events step: choose the alerts
Here you pick the event types, presented in a tree grouped by domain. Expand your device's domain and check the events you care about; in the example, Person Detection under hanwha.cctv.channel.
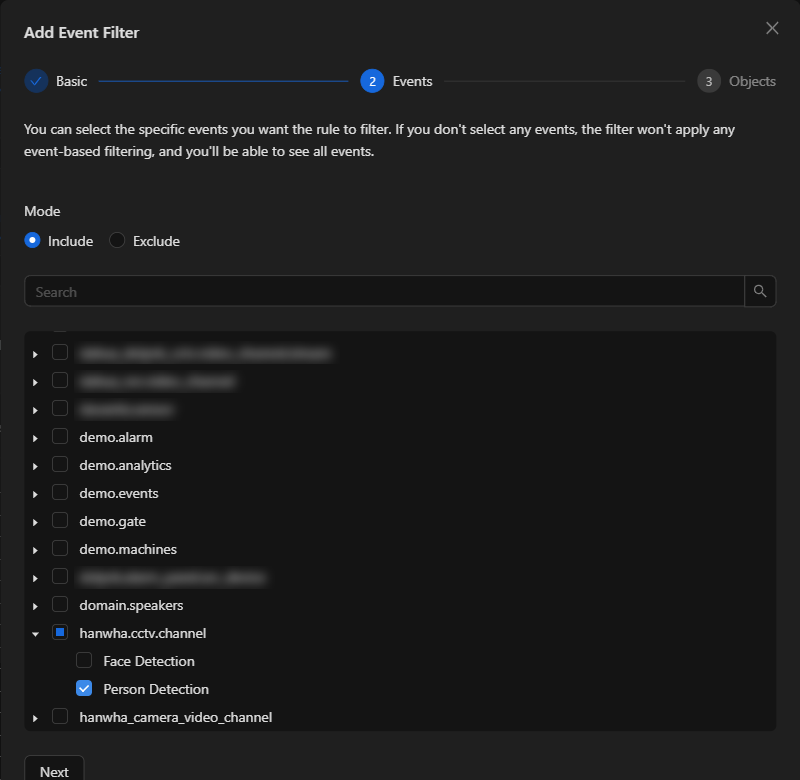
The Mode field defines how the selection is applied:
Include: the log shows only the checked events. This is what we want here.Exclude: the log shows everything except the checked events. Useful when what you want is to silence a noisy event type.
IMPORTANT: If you check no events, the filter applies no event-type criteria at all and you will see every event. The screen itself warns you about this. The domains in the tree are there only for grouping: they cannot be checked as a criterion, you have to pick the specific events.
Click Next.
4.3 Objects step: choose where from
Now you narrow down the source. The selector at the top lets you choose between Groups and Devices:
Devices: search for your device by name and check the specific object. In the example, insideHanwha camerawe check video channel0under thehanwha.cctv.channeldomain.Groups: select an entire group, useful when you want to monitor a whole building or area without listing object by object.
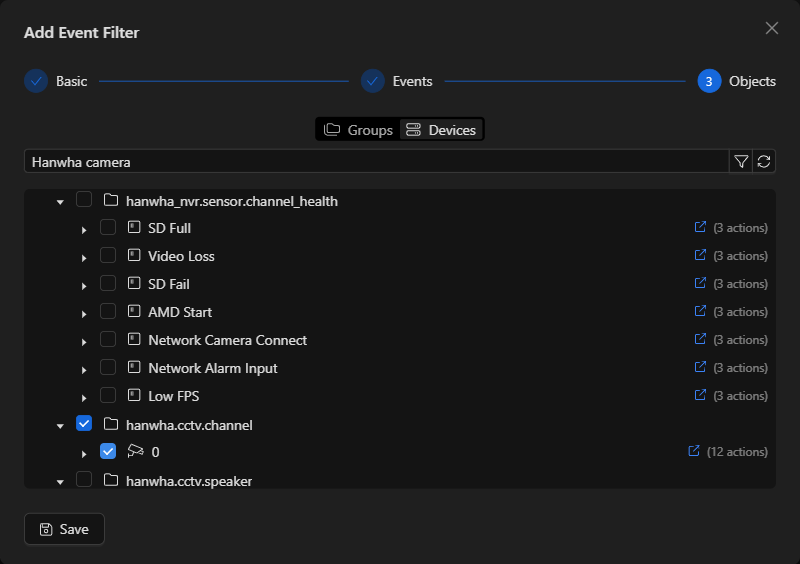
TIP: A single device exposes several domains. This camera publishes its analytics as sensors under
hanwha_nvr.sensor.analyticsand the channel status underhanwha_nvr.sensor.channel_health, on top of its video channel underhanwha.cctv.channel. Check the object that actually emits the event you chose in the previous step.
If you check no objects, the filter applies to events from any object.
Click Save.
Step 5: Attach the filter and save the log
Once saved, the filter appears in the table and is attached automatically to the log you are creating (you will see its box checked):
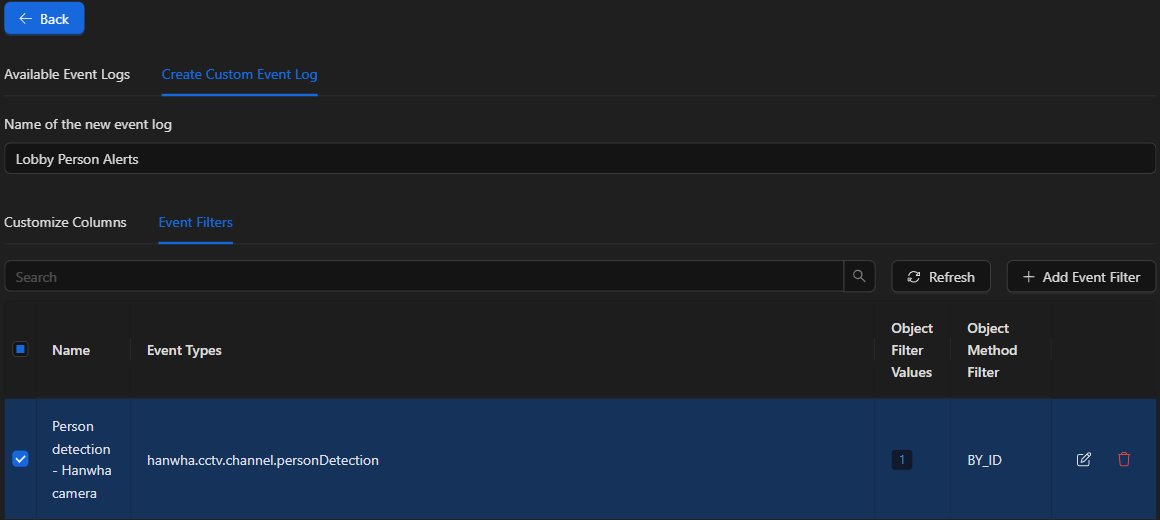
The table summarizes each filter: its Name, the Event Types it applies, how many objects it filters (Object Filter Values) and with which method (Object Method Filter) — BY_ID when you picked specific objects, BY_GROUP when you picked a group. When a filter is in exclude mode, its event types are prefixed with Exclude :.
In this table you can also check filters that already existed to reuse them in this log, or edit and delete them with the buttons on the right.
When you are done, click Save. The log is created and appears in the list on the Available Event Logs tab with its column and filter tags.
Step 6: Use the log
To show it in the widget, click the select button (✓) on its card.
The log is saved in the system, so it also appears in the Dashboard Tree, under Events Log. From there you can drag it into any slot of any dashboard:
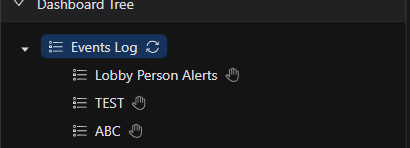
TIP: If you just created the log and it doesn't show up in the tree, use the reload icon that appears next to
Events Logwhen you hover over it.
The result is a log that shows only what you defined — in the example, nothing but the person detections from that camera:
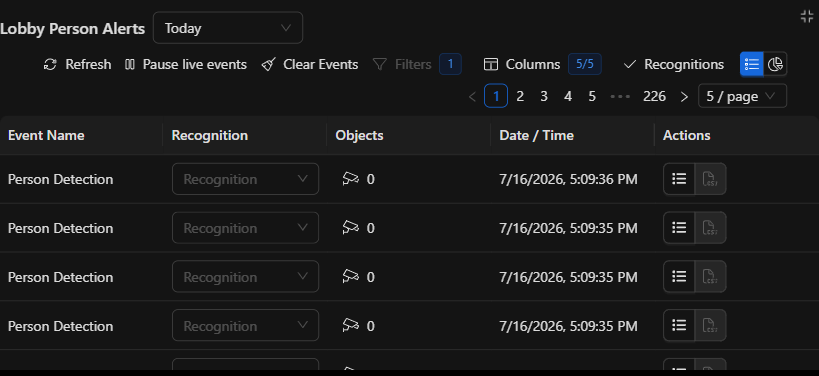
The widget bar
Once the log is loaded, the top bar offers:
| Control | What it does |
|---|---|
| Date selector | Narrows the period queried: Today, Yesterday, This week, This month or Custom. |
Refresh |
Queries the history again. |
Pause live events |
Stops new events from coming in. While paused, incoming events pile up and the button shows how many there are; when you resume, they all come in at once. Useful for reviewing something without the table moving. |
Clear Events |
Empties the table on your screen only. It deletes nothing from the system: on refresh or reload, the events come back. |
Filters |
Not a button: it is an indicator showing how many filters are attached to the log. It always appears disabled. |
Columns |
Temporarily hides or shows the log's columns. |
Recognitions |
Manages the tracking tags applied to each event. |
IMPORTANT: Filters cannot be edited from the widget. The
Filtersbutton is disabled on purpose and only reports the count. To change which events come in, edit the log with the pencil button inAvailable Event Logsand modify itsEvent Filterstab.NOTE: The
Columnscontrol only lets you hide and re-show the columns the log already has configured, not add new ones, and its effect is not preserved when you reload the page. To change the columns permanently, edit the log.
Keep in mind
- You need permission. Creating, editing and deleting custom logs depends on the
eventLog:canCreateCustomWidgetEventLog,eventLog:canEditWidgetEventLogandeventLog:canDeleteWidgetEventLogpermissions. If you don't see the options, check with your administrator. - Logs and filters are shared, not personal: deleting a filter makes it unavailable to every log that uses it.
- The search box in the
Eventsstep does not filter the event-type tree; to find your domain you have to scroll through the list. - A log with no filters is equivalent to the admin log: it will show every event.