Dashboard carousel
A monitoring center almost never has a single view. There are the perimeter cameras, the fleet map, the indicators for the day, the access control board… and a single video wall screen to show them on.
The carousel solves that: it rotates automatically between several dashboards, each for as long as you decide, without anyone touching a keyboard. It is the view for screens nobody operates: the wall, the control room, the supervision hallway.
NOTE: The carousel rotates entire dashboards, not cameras. To rotate cameras within a single screen, what you need is a video layout; that is covered in Viewing live cameras.
Where it is created
In the dashboard's top bar, open the gear and then the menu button (☰). It expands to:
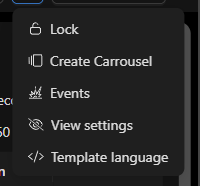
Choose Create Carrousel.
Building the carousel
A split screen opens: on the left the tree of available dashboards — organized into Private (yours) and Public (shared), with their folders — and on the right the list of the carousel you are building.
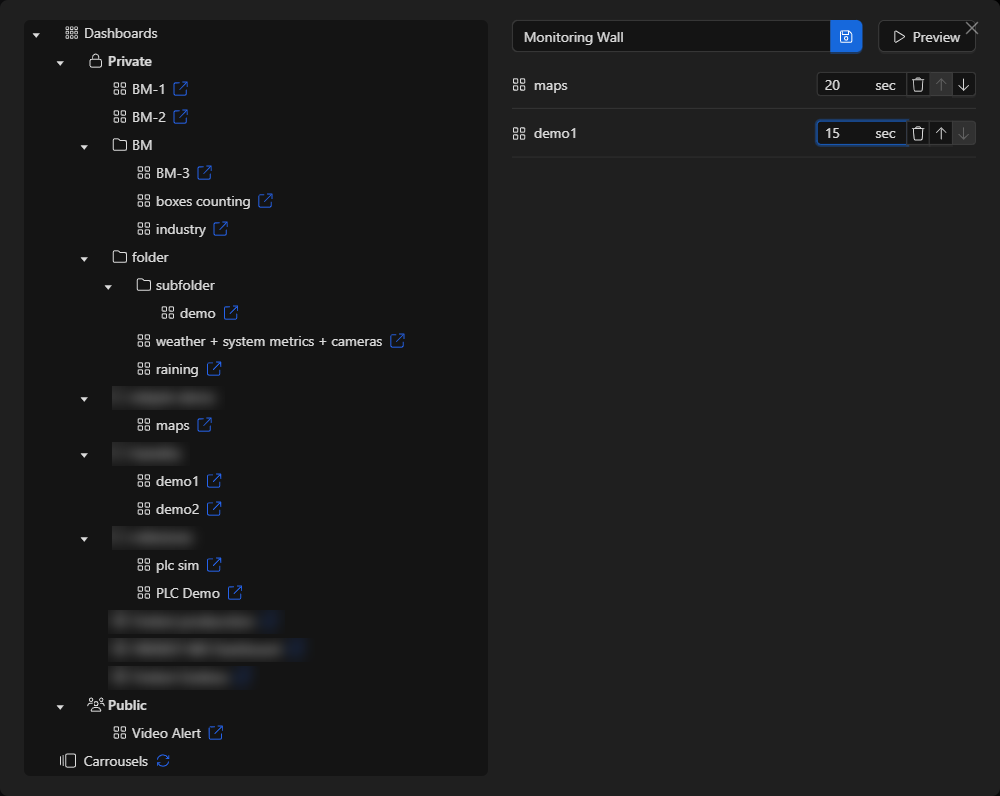
- Name the carousel in the field at the top right.
- Drag each dashboard from the tree on the left into the list on the right. It is added at the end, with 5 seconds by default.
- Adjust the seconds for each one in its
secfield. It is time per dashboard, not a global value: you can leave 30 seconds on the camera wall and 10 on the indicators board. - Order the sequence with the ↑ ↓ arrows on each row, and remove what you do not need with the trash can.
- Save with the floppy disk button. The Preview button lets you see how it looks before making it permanent.
Once saved, the carousel is available under the Carrousels node of that same tree, so you can reopen and edit it whenever you want.
TIP: Less is more. A carousel of three or four dashboards with generous timings is easy to follow; one with ten dashboards at five seconds each is impossible to read and only creates visual noise.
Launching it on the screen
From the Carrousels node, the ↗ icon next to the name opens the carousel in a new tab, already without the sidebar: a clean screen for the wall.
On opening, it asks whether you want full screen:
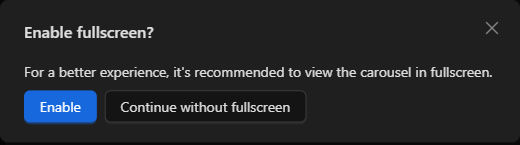
- Enable: switches to full screen. This is what you want for the video wall.
- Continue without fullscreen: leaves it in the window, useful while you are setting it up from your own station.
Once running, a progress bar along the top edge shows how long is left before the next change:
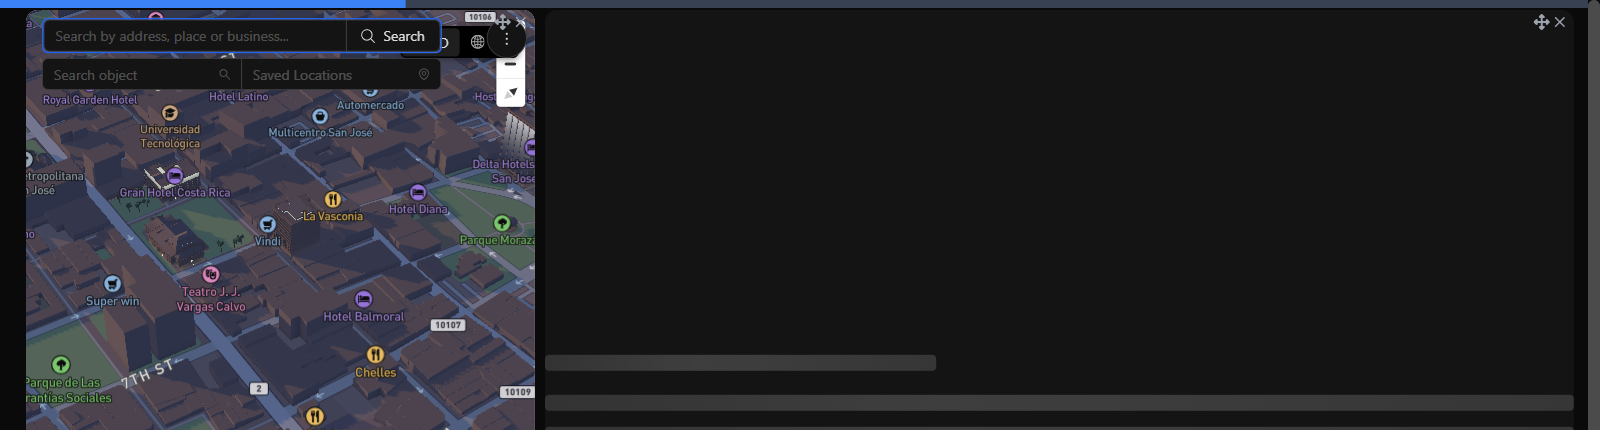
The change between dashboards is a smooth transition, and the next board is preloaded before its turn, so it appears ready instead of building itself on screen.
What happens if someone touches the machine
The carousel pauses by itself when it detects mouse movement and resumes a few seconds after the machine goes still again. This is deliberate: if someone walks up to the screen to look at something, there is no point in the board changing right then.
The progress bar shows this through its color: blue while it advances, red while it is paused by mouse movement.
NOTE: This behavior is verified on the platform: moving the mouse turned the bar red, and it went back to blue a few seconds later, resuming the rotation on its own.
When the carousel does not look right
| Symptom | Usual cause |
|---|---|
| A dashboard shows a widget in error | The problem is the widget, not the carousel: the data source is failing or the user who opened the carousel has no permission on that object |
| A dashboard comes up empty | It really is empty, or its widgets did not load in time. Give it more seconds |
| It does not rotate | It is paused by mouse movement; check the color of the top bar |
| It rotates too fast | Seconds are configured per dashboard; review the list, the default is 5 |
| I cannot find my dashboard in the tree | It is in another user's Private branch. Only your own and public dashboards appear |
Previous: Sounds and events · Next: Viewing live cameras