Filtering the event log
The Event Log is the operator's main tool: a real-time list of everything the platform detects. In an installation with several devices that means thousands of events per day — in the lab where these screenshots were taken it was up to 4,427 before midday — so knowing how to narrow down what is displayed is not a luxury: it is the difference between monitoring and drowning in rows.
This chapter covers what you can do without leaving your station, on the log you already have on screen.
Choosing which log you are looking at
Before filtering anything, it helps to know which log your widget has loaded. Adding an Event Log widget opens this screen:
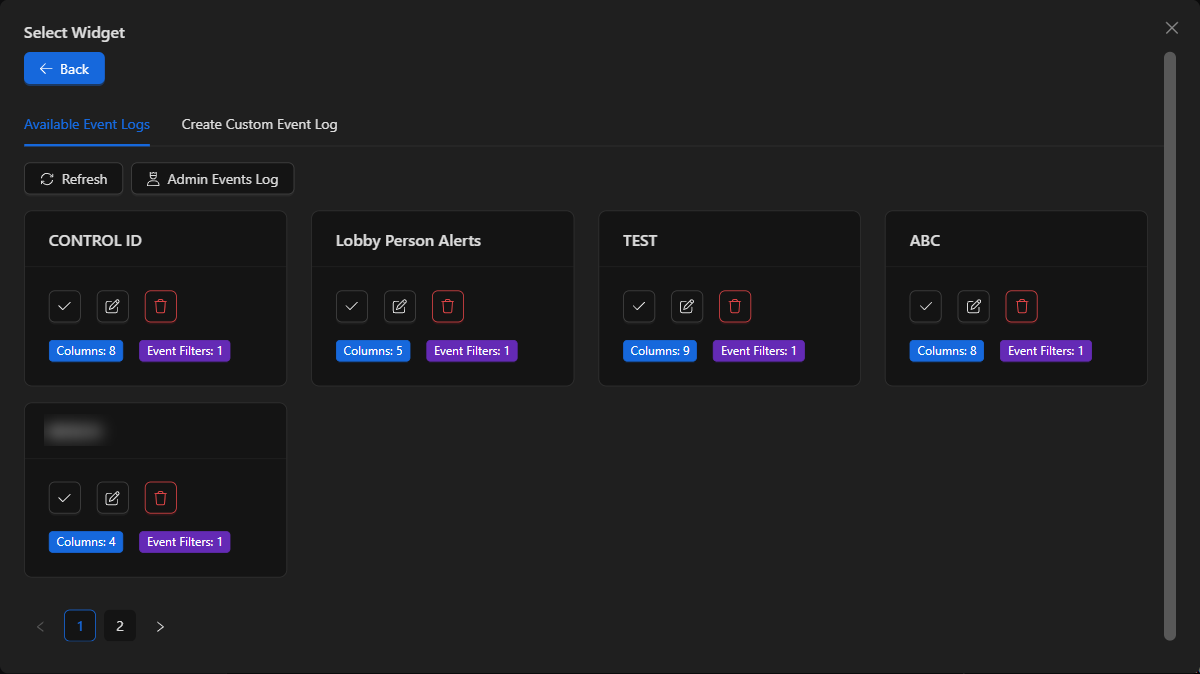
- The Admin Events Log button loads the log with no filters: it shows absolutely every event in the system. It is the right choice for diagnosis ("is anything coming in from this camera?"), but the worst one for watching a shift.
- The cards are the saved logs. Each one shows how many Columns it displays and how many Event Filters it has attached. The three buttons on each card let you, in order: use that log in the widget, edit it and delete it.
A saved log already comes narrowed down to what matters at a specific station — person detections at reception, for example — so choosing the right log is the first and most effective filter. To create a new one, see Create a custom Event Log.
NOTE: Cards are shown five per page. If you cannot find your log, check the paginator below them: the rest are on the following pages.
The log toolbar
Everything that follows is done from this bar, above the widget:

| Control | What it does |
|---|---|
| Time range (Today, Yesterday…) | Narrows the period being queried |
| Refresh | Requests the events from the server again |
| Pause / Resume live events | Freezes the table without losing incoming events |
| Clear Events | Empties the table on screen |
| Recognitions (funnel icon) | Filters by how the event was handled |
| Columns | Shows or hides columns |
| Recognitions (check icon) | Opens recognition management |
| Table / KPI | Switches between the list and the indicator view |
Narrowing by time
The first dropdown in the toolbar defines how far back events are retrieved:
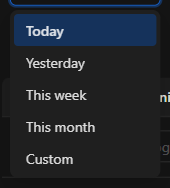
- Today, This week and This month run from the start of the period until now.
- Custom enables a date picker so you can choose an exact start and end. This is the one used when investigating a specific incident.
The range you choose is remembered for that widget when you reopen the dashboard, even after a page reload.
IMPORTANT: The Yesterday option does not show yesterday alone: it queries from the start of yesterday through the end of today, that is, yesterday and today together. Verified on the platform. If you need exactly the previous day, use Custom and set both dates by hand.
Freezing the table without losing events
When the flow is heavy, reading a single row is impossible: the table keeps moving on its own. That is what Pause live events is for.
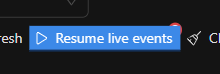
When you pause, the button turns blue, changes to Resume live events and shows a counter of the events that arrived while you were reading. Nothing is lost: they all come in at once when you resume. In a busy environment that counter climbs fast — a 30-second pause reached 99+ — so pause only for as long as you need.
TIP: Pausing is the right way to read an event; Clear Events is not. That button empties the table on screen so only what arrives from now on is left. It deletes nothing from the system: the events are still stored and come back when you refresh or change the time range.
Filtering by how events were handled
This is the most useful filter of the shift and the one most often overlooked. The funnel Recognitions button opens:
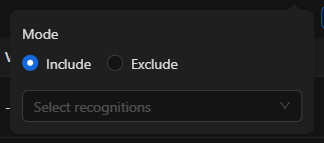
A recognition is the label an operator uses to record how an event was handled: In progress, Closed, False Alarm, Dismissed, Follow up, and so on. This filter decides which states you want to see:
- Include: shows only the events with the states you tick.
- Exclude: shows everything except those states.
The list also has a special option, Unrecognized, which groups the events nobody has handled yet.
That gives you the two setups most used at a station:
- Include → Unrecognized: your to-do list. Only what is still pending.
- Exclude → Closed, False Alarm: the shift view, without the noise of what is already resolved.
The button stays highlighted while the filter is active and shows how many states you selected, so you do not forget you are looking at a trimmed list.
Choosing columns
The Columns button shows which columns are visible and the total (9/9, for example):
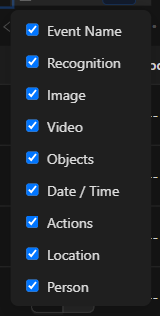
Unticking columns does not change the data, only your view, and it is the quick way to gain screen space: at a video station Event Name, Image, Objects, Date / Time and Recognition are what you need, and the rest is surplus.
Columns can also be reordered by dragging their header, and the order is saved. That detail is covered in Column Reordering.
Looking at the summary instead of the list
The last pair of buttons switches between the table and the KPI view, useful at the end of a shift or for a supervisor:
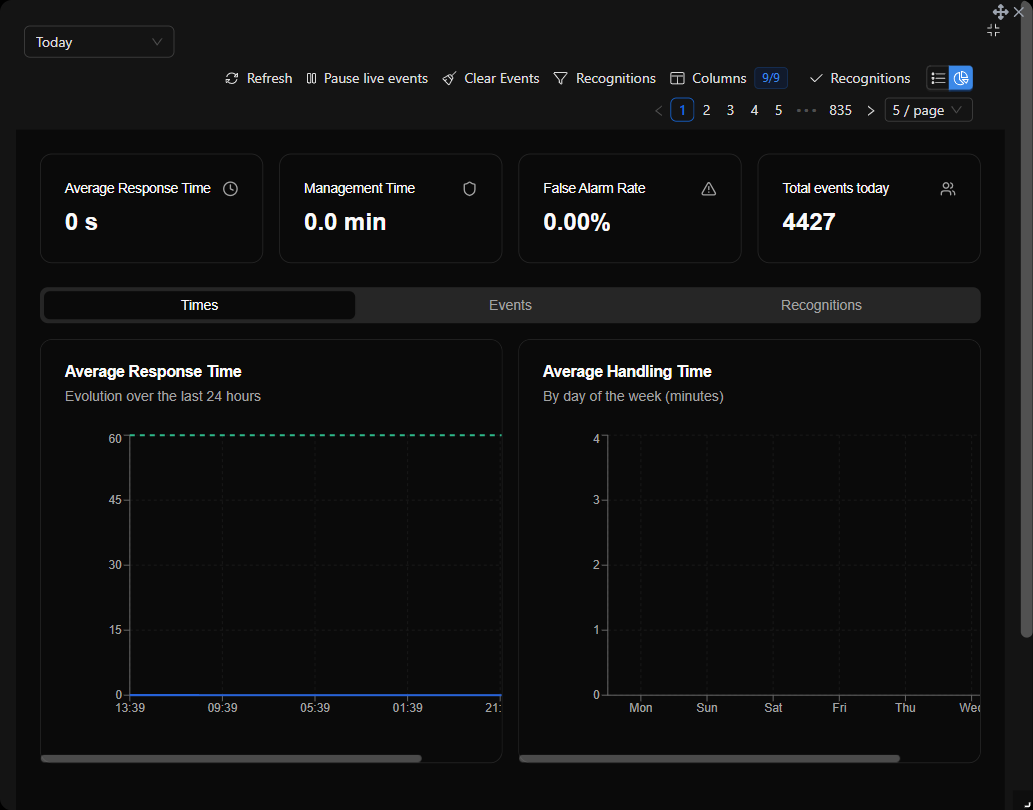
It shows average response time, handling time, false alarm rate and total events for the day, plus the trend over the last 24 hours and the average handling time by day of the week.
When the list does not show what you expect
| Symptom | Usual cause |
|---|---|
| No events at all | The time range is too short, or the log has a filter that excludes what you are looking for |
| Too many events | You are on the Admin Events Log, which filters nothing |
| Events that did happen are missing | The Recognitions button has an active filter (check whether it is highlighted) |
| The table does not update | The log is paused: the button reads Resume live events |
| Yesterday and today appear mixed together | That is the Yesterday preset; use Custom |
Next: Sounds and events — why the platform alerts you with audio and how it is configured.